After a first article (Kubernetes Dashboards 1) on generalist Kubernetes Dashboards, this article focuses on those dashboards that are geared to certain needs.
Specifically we will focus on three dashboards that go to three needs: Look into the status of a large number of pods, see the relationships between objects and get an overview on a platform kubernetes on docker.
Table of Contents
Kubernetes Dashboards
Kube-ops-view
With 1200 stars in Github, this project presents a very basic dashboard thinking of large server farms, where we have an important volume of pods that we need to review at a glance.
How to install
We create a namespace to install kube-ops-view:
kubectl create namespace kube-ops-view --dry-run -o yaml | kubectl apply -f -We create a system account with administrator capabilities
kubectl create -n kube-ops-view serviceaccount kube-ops-view-sa --dry-run -o yaml | kubectl apply -f -
kubectl create clusterrolebinding kube-ops-view-sa --clusterrole=cluster-admin --serviceaccount=kube-ops-view:kube-ops-view-sa --dry-run -o yaml | kubectl apply -f -
And we do execution of a deployment together with a service for its publication
cat <<EOF |kubectl apply -n kube-ops-view -f -
 ---
apiVersion: v1
kind: Service
metadata:
  name: kube-ops-view
  namespace: kube-ops-view
spec:
  ports:
  - name: http
    port: 80
    protocol: TCP
    targetPort: 8080
  selector:
    app: kube-ops-view
  type: LoadBalancer
---
apiVersion: apps/v1
kind: Deployment
metadata:
  labels:
    app: kube-ops-view
  name: kube-ops-view
spec:
  replicas: 1
  selector:
    matchLabels:
      app: kube-ops-view
  template:
    metadata:
      labels:
        app: kube-ops-view
    spec:
      serviceAccountName: kube-ops-view-sa
      containers:
      - image: hjacobs/kube-ops-view:0.11
        name: kube-ops-view
        ports:
        - containerPort: 8080
Despite being a single service (without authentication, important), its container is similar in size to the solutions shown before:
docker.io/hjacobs/kube-ops-view 0.11 fd70a70b6d70d 40.8MBSo its deployment must be fast.
Features
Its interface, shown in the following figure is minimal:
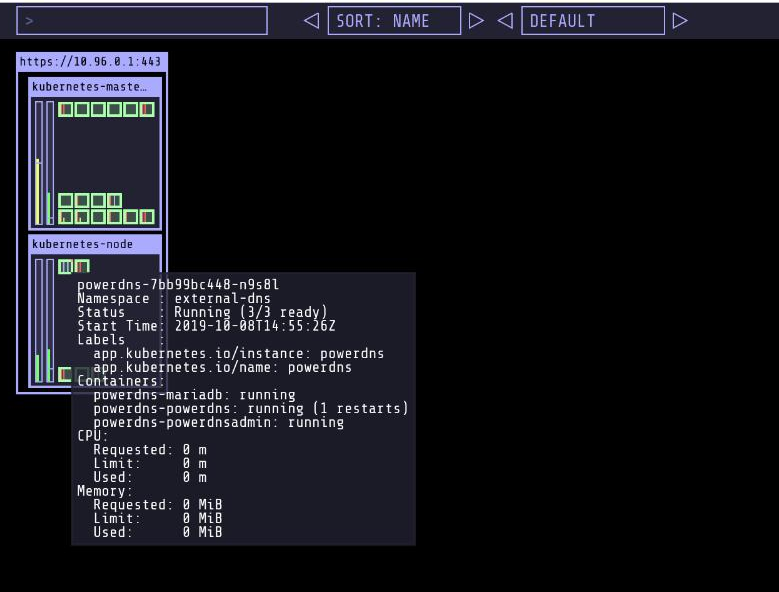
Without options to enter the objects or to edit, the information appears when passing over the “boxes”.
Easy to use
Clearly limited for those who start in Kubernetes or want additional information about objects, but very useful for those who want to visualize large volumes of pods.
Kubeview
Although with only 150 stars on github, this project focuses on representing the relationships between objects in Kubernetes. Being very interesting for demonstrations.
How to install
Until the Helm Chart is developed (https://github.com/benc-uk/kubeview/tree/master/deployments/helm) It is installed in the “default” namespace by installing two files:
kubectl apply -f https://raw.githubusercontent.com/benc-uk/kubeview/0.1.8/deployments/service-account.yaml
kubectl apply -f https://github.com/benc-uk/kubeview/blob/0.1.8/deployments/deploy.yaml
The first file includes the user account kubeview and the corresponding permissions, the second the deployment together with a service type “LoadBalancer”.
The image size is small and its deployment is fast.
docker.io/bencuk/kubeview latest cb6456b6cbcf7 16.1MBFeatures
Kubeview is simple and its graphic configuration makes it very interesting to teach Kubernetes or presentations. Its menu consists only of a name space selector and a window refresh time.

When we select a namespace it will show us all the objects that said namespace has. In this way we can at a glance see the relationships and elements such as the IPs of publication of the services.
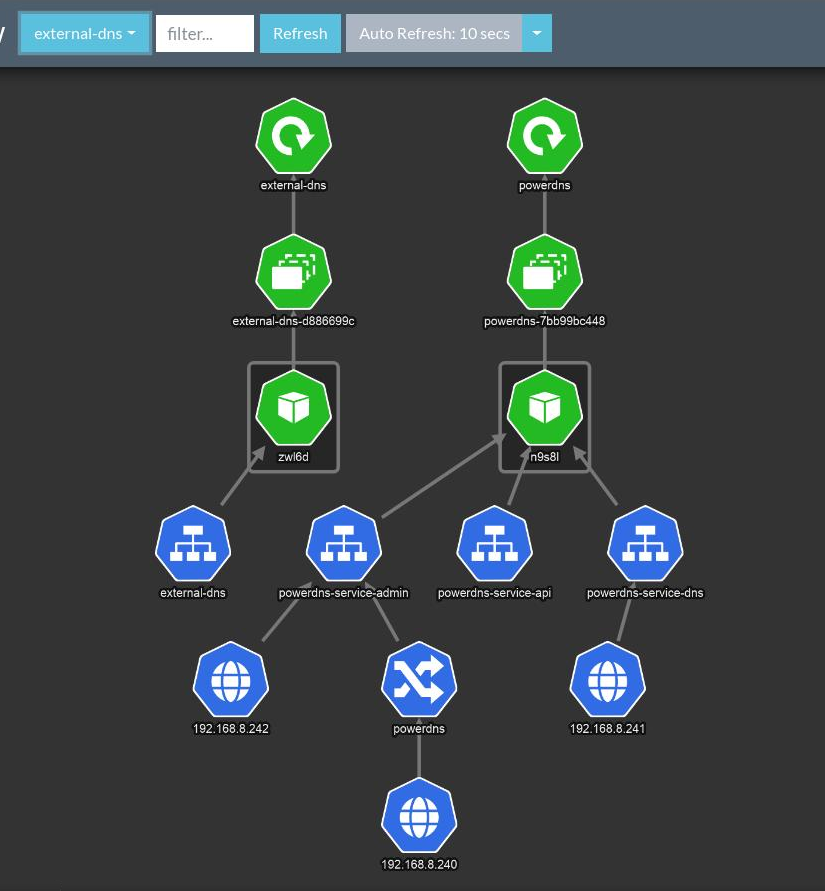
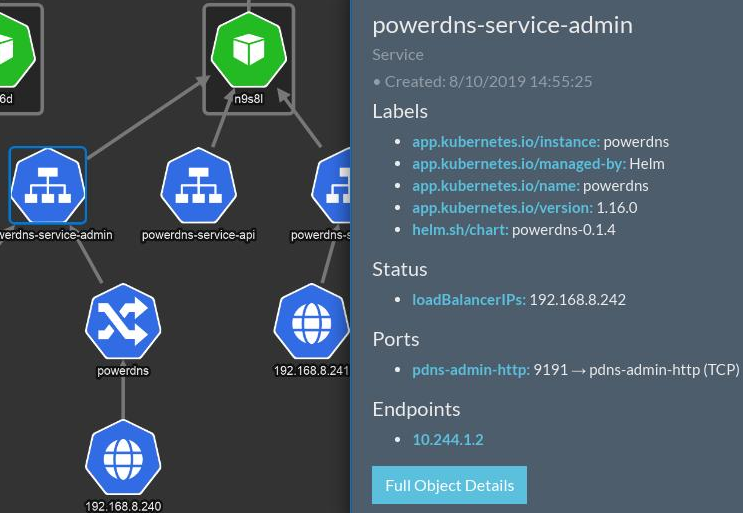
When we select an object (for example a service) it shows descriptive information about it.
Easy to use
Very basic and with functions limited to training or demonstration. It has no major pretensions, which are to show the relationships between objects.
Weave-Scope
This interesting project has 3700 stars on github. It is intended as a tool that covers all possible elements in a deployment with docker as runtime and weave as a network manager.
How to install
We will use helm to deploy it (we use helm v3):
kubectl create namespace weave-scope
cat <<EOF |helm install -f - -n weave-scope weave-scope stable/weave-scope
service:
  type: "LoadBalancer"
EOF
It uses three different images to display three types of services, one is the console, the second one is a cluster monitoring agent and the third one is a node monitoring agent, but it has a strong dependence with docker that we will see affects the results in non-docker environments.
Features
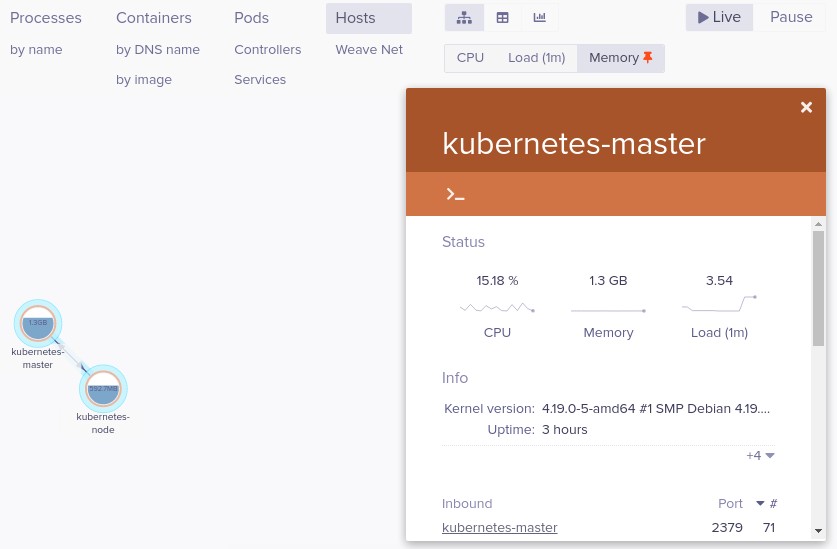
The menu is distributed on the screen and does not make direct reference to Kubernetes objects, we start with the nodes and it has the interesting feature of displaying information about them without requiring multiple circles.
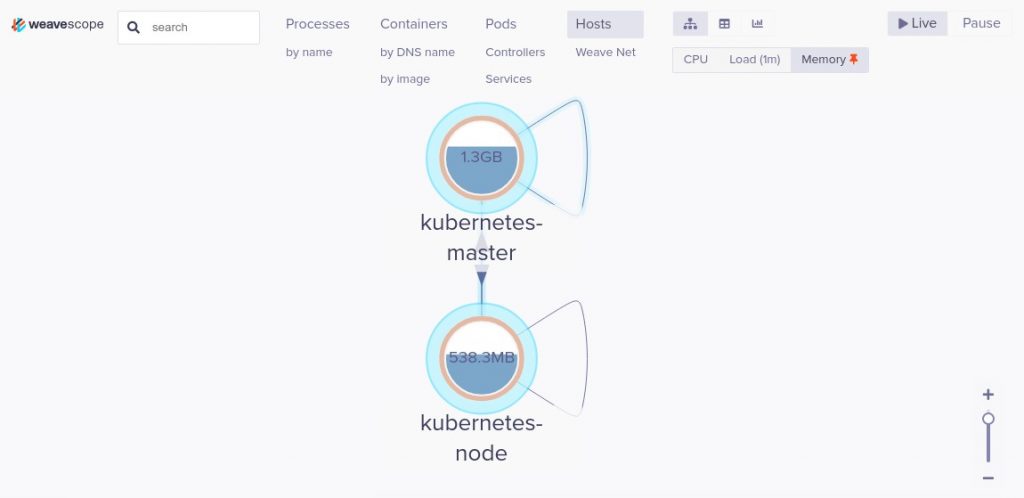
By selecting a node we can obtain detailed information about it.
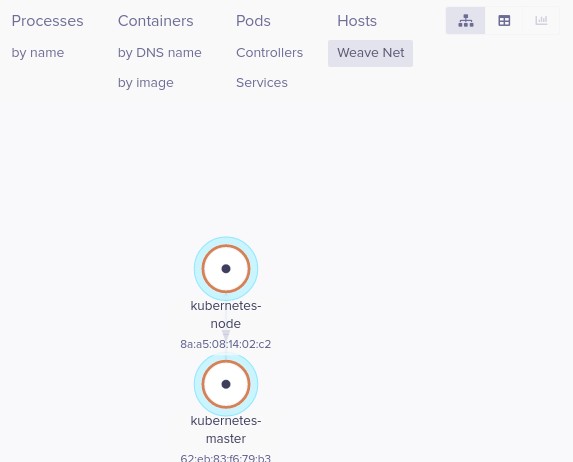
It has a menu option to show the Kubernetes nodes with Weave although I could not get more information than the node mac.
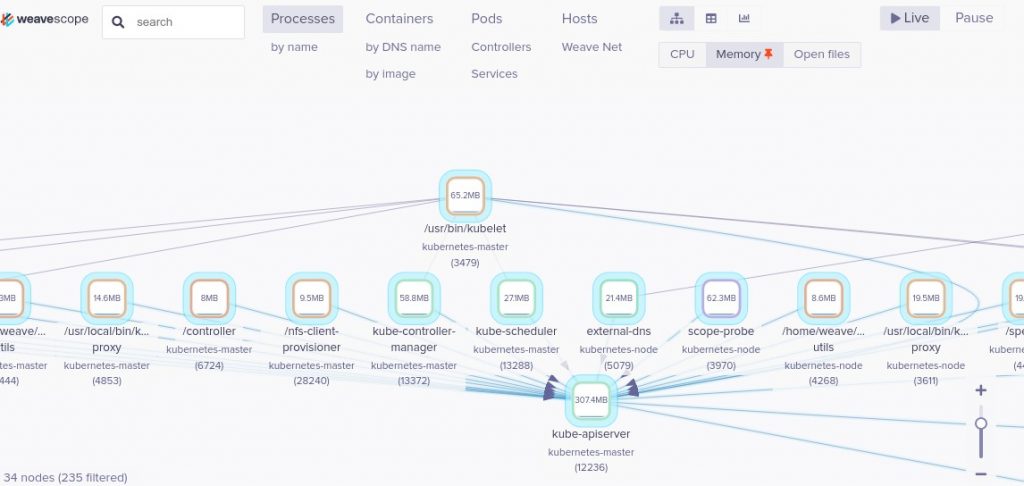
On the other side of the menu we have the interesting process option, which shows a global state of all of them, in this case there are few interesting (for training or demonstration) but it is not identified as useful for a production environment.
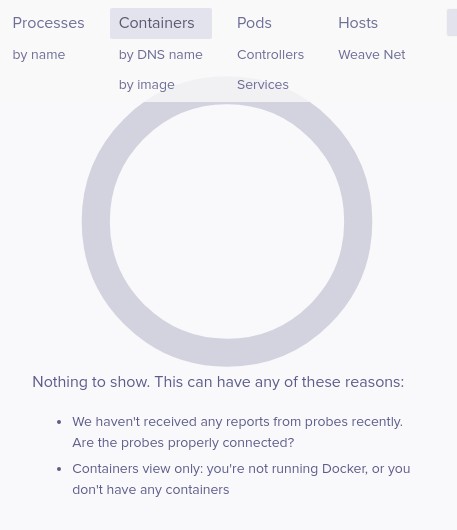
If we select a namespace and we ask you to show us the pods we can have bad news, containerd does not support. Since it is specially designed in the Docker API, using a runtime directly (CRI-O or Containerd) does not allow us to access the information of the containers, which is an important limitation in environments other than Docker Enterprise.
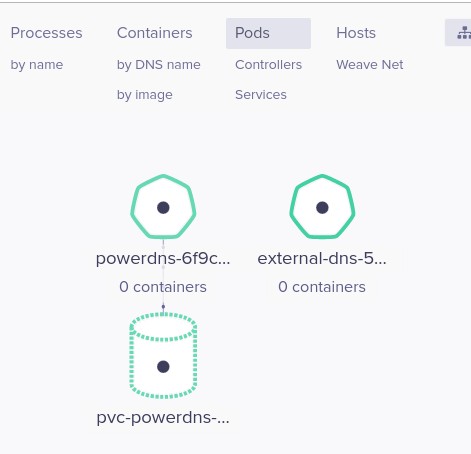
This limitation is clearly seen in the Containers menu, where information is not actually displayed.
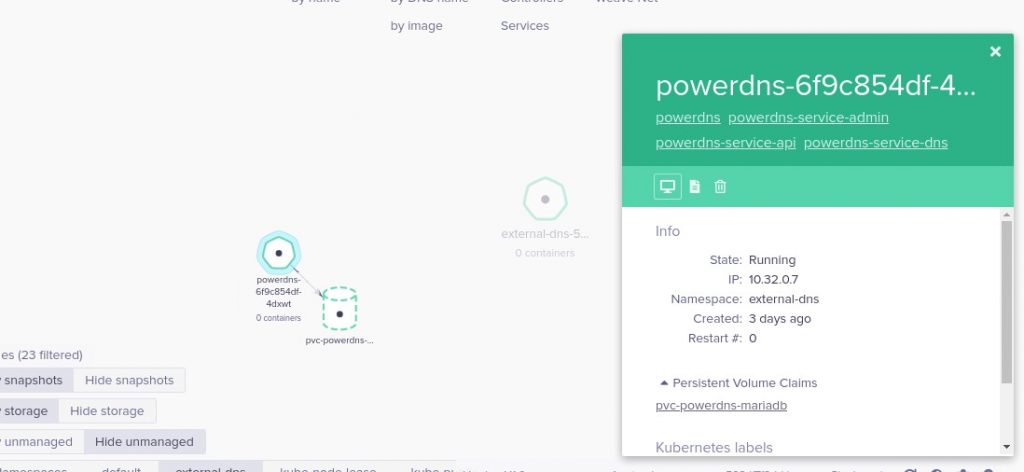
When we select a pod we have a description of it and three options, the first is to show the logs, the second is to edit the pod code and the third is to delete it.
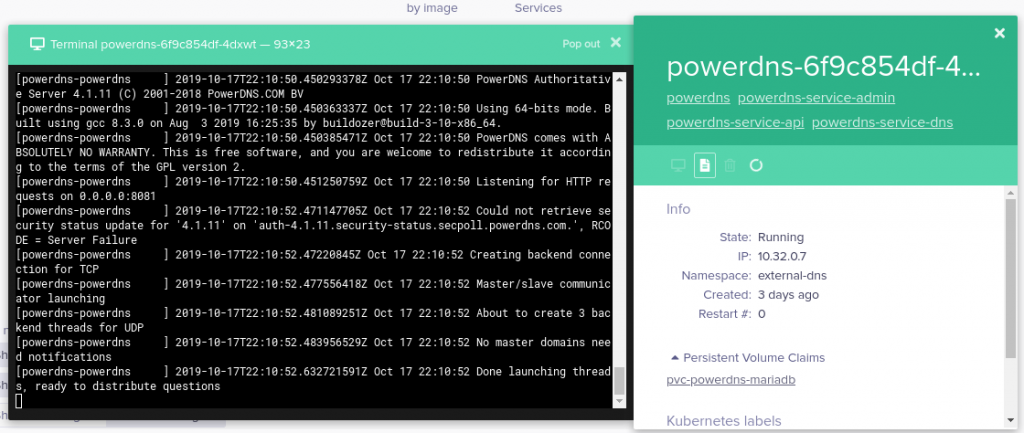
The problem in multi-container pods is that it only shows us the logs of the initial container, and not logs of the other containers that make up the pod.
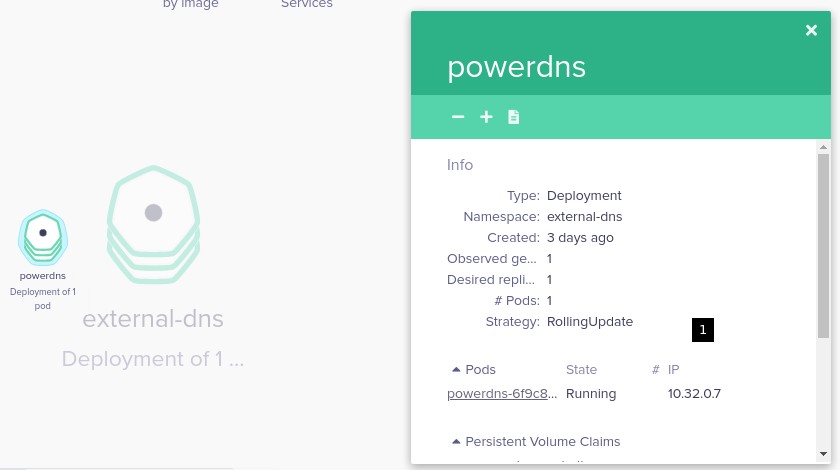
In the case of deployments it shows the options to scale and edit (and not to eliminate)
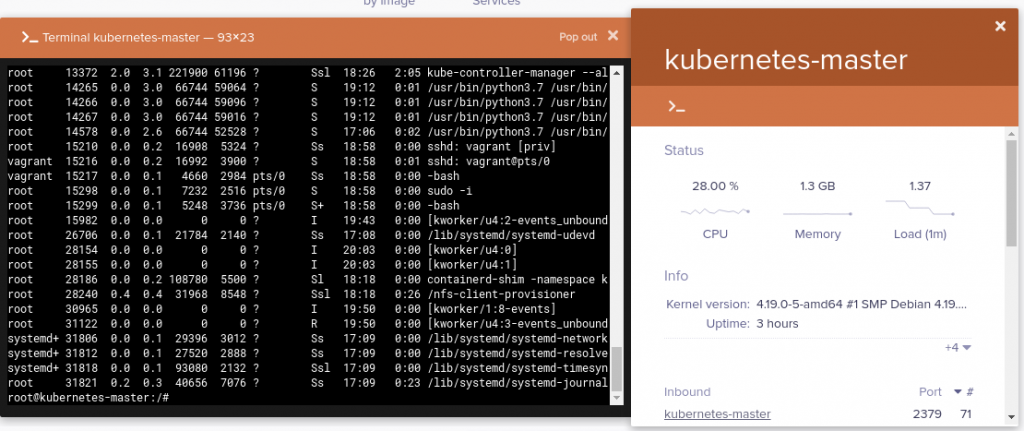
Finally, we review an interesting capacity, which consists in being able to open a shell from the web in the nodes of the service. Although outside a demonstration environment such capacity is more insecure.
Easy to use
Despite its promising design, the docker dependency makes it a niche option that cannot be taken to most Kubernetes-based solutions, since you are using it as a runtime containerd or CRI-O.
In the last article of this small guide we examine those dashboards that will not work as an integrated element in Kubernetes but as external elements with access to resources such as octant and kontena.