One of the first difficulties when starting to work with Kubernetes is the lack of understandable tools to manage Kubernetes. Kubernetes dashboards (platform management tools) become the entry point for those who want to learn Kubernetes.
In this series of articles we will examine some of the most used dashboards, including some more specific (octant, kontena) and leaving those oriented to PaaS / CaaS (Rancher, Openshift) because in both cases the scope of entry level Kubernetes tools is exceeded.
Table of Contents
Kubernetes dashboards
Kubernetes Dashboard
With more than 6000 stars on GitHUb, the official Kubernetes dashboard is the standard option for this type of solutions, because of its dependencies and its lack of compatibility with the current versions of Kubernetes we will only focus on v2 versions -beta3.
How to install
Executing the command:
kubectl apply -f https://raw.githubusercontent.com/kubernetes/dashboard/v2.0.0-beta3/aio/deploy/recommended.yamlIt is installed in the “kubernetes-dashboard” namespace and to obtain the metrics it uses the “dashboard-metrics-scraper” service that is installed in the same namespace.
It must be accessed via external IP (LoadBalancer or kubectl proxy service), or configure an Ingress with the same SSL certificates as the console (which complicates its deployment).
The containers that are part of this solution are:
docker.io/kubernetesui/dashboard                  v2.0.0-beta3        6feddba9df747       32MB
docker.io/kubernetesui/metrics-scraper          v1.0.1               709901356c115       16.1MB
So its deployment has to be fast, since although they are two services, they are small in size.
Features
It has a clean and clear interface, token authentication and a dashboard where on one side we have all the main elements of Kubernetes and in the main part of the panel a list of the selected elements in the selected namespace.
Main panel:
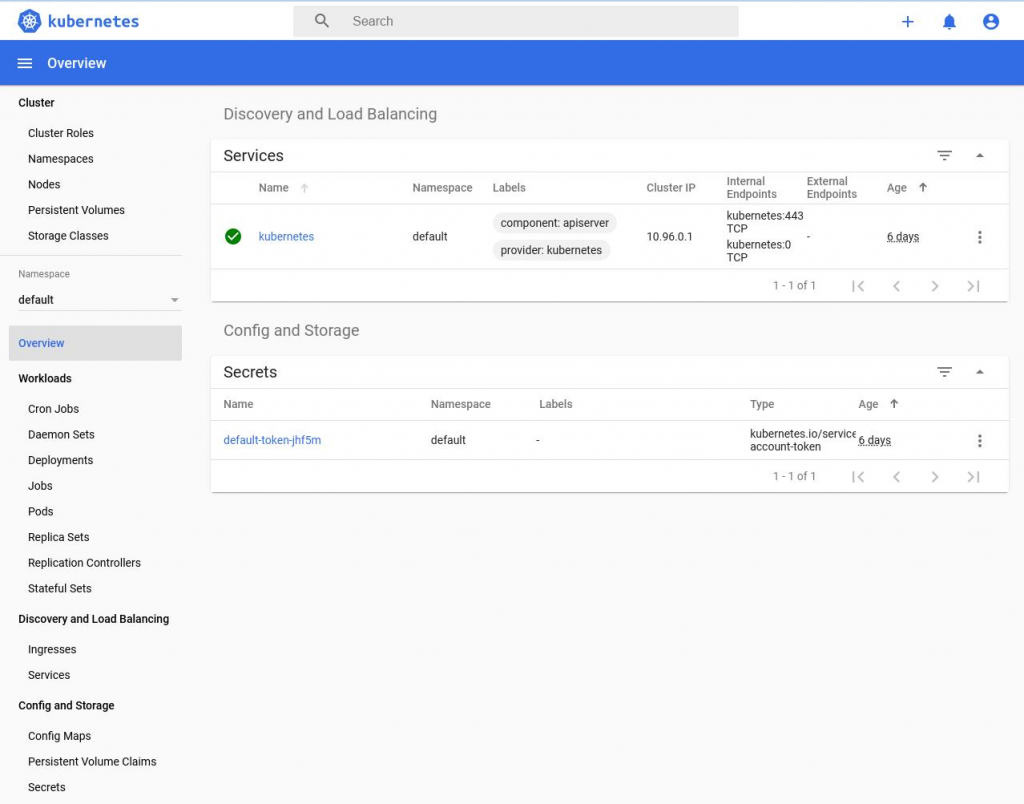
For convenience, it has a dark theme, among the elements it allows access to, we have security roles. In addition, each selected element has two actions: edit and delete.
Role editing:
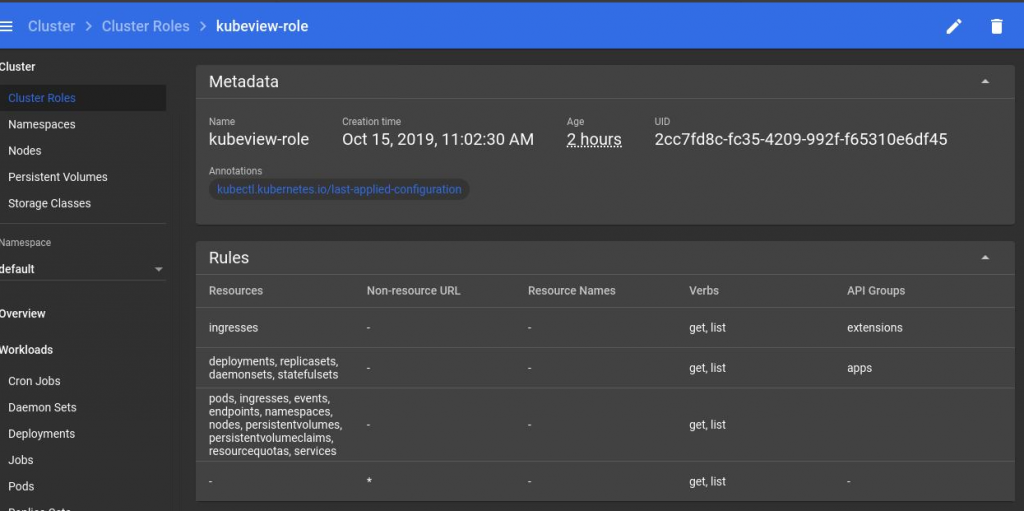
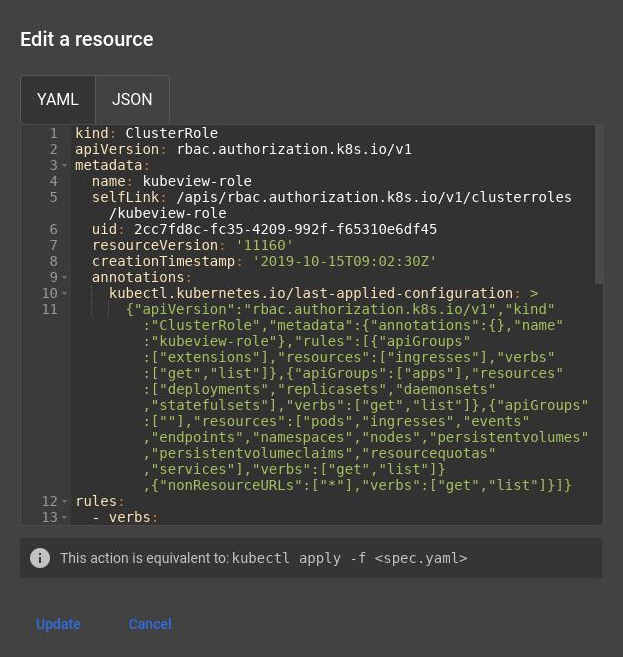
The edit action gives us access to the object that defines the selected element in yaml or json formats. No specific editor is defined in any element that allows the management of the object for those not aware of its structure.
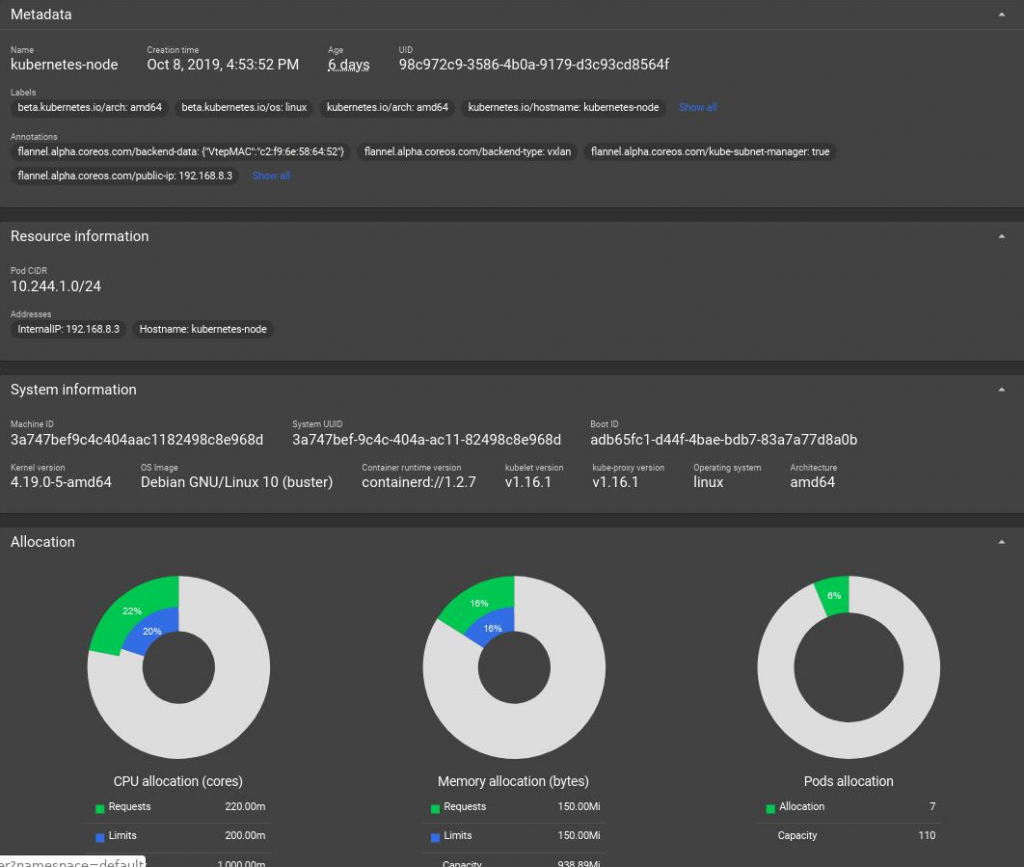
Node Information:
When we select a node we get a lot of information about it.
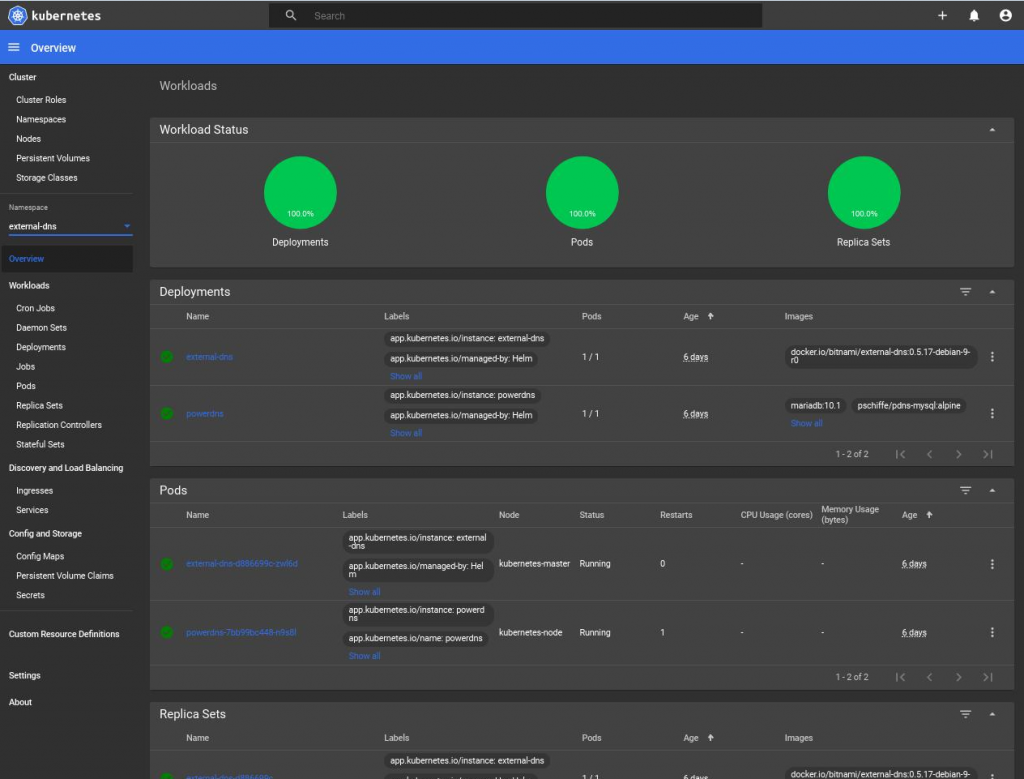
Control panel over a namespace:
Selecting a namespace without selecting any element will show us a status box of that namespace with the elements that form it and the status of each of them.
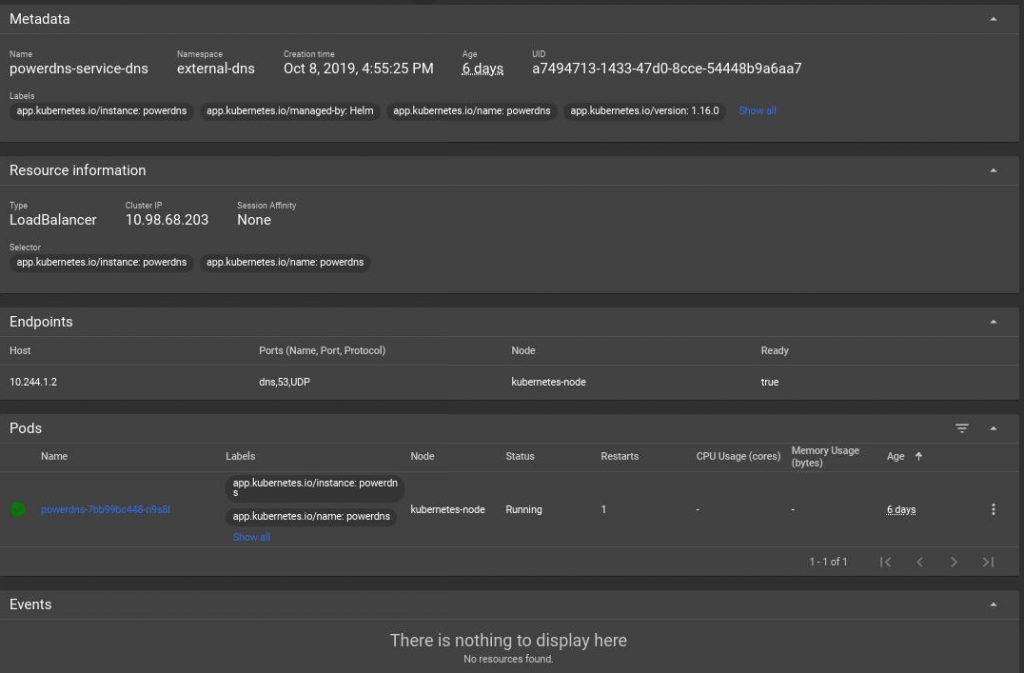
Information about an item:
The information is also exhaustive when we enter any object, in this case a service:
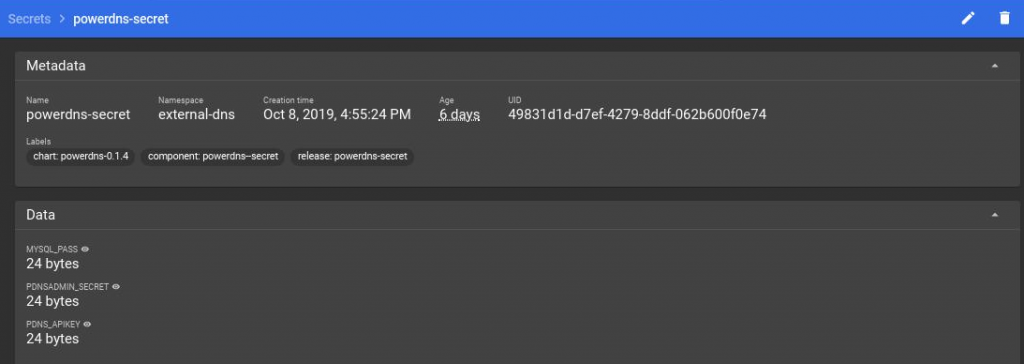
Secrets manipulation:
In some objects such as secrets allows us to visualize their data:
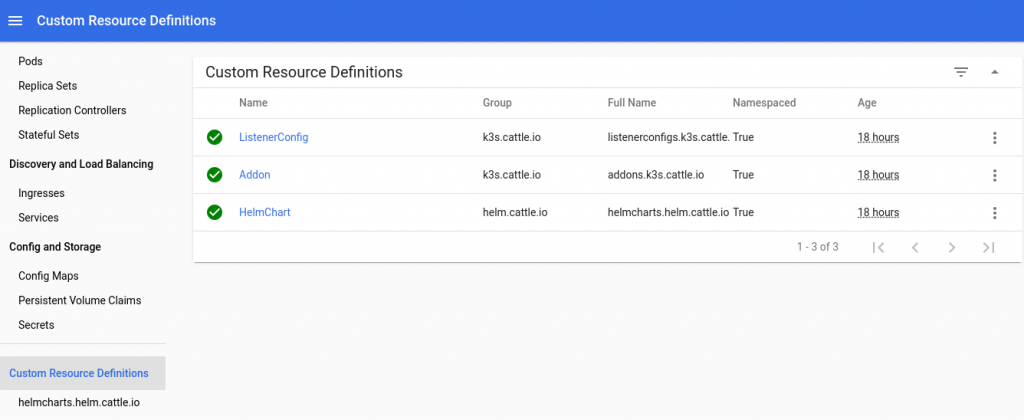
CRD configuration:
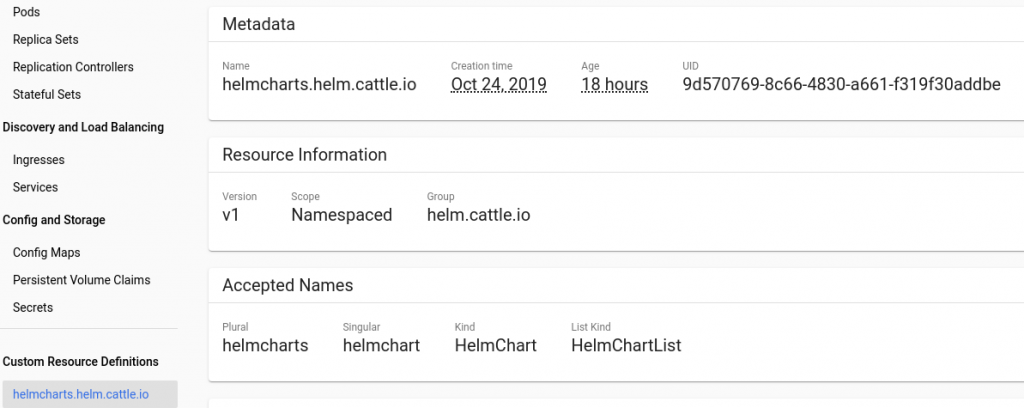
One of the elements of the side menu is the CRD, where we can find those objects defined by applications such as the Helm package system. It has an option that sets the CRD to the menu allowing quick access to it.
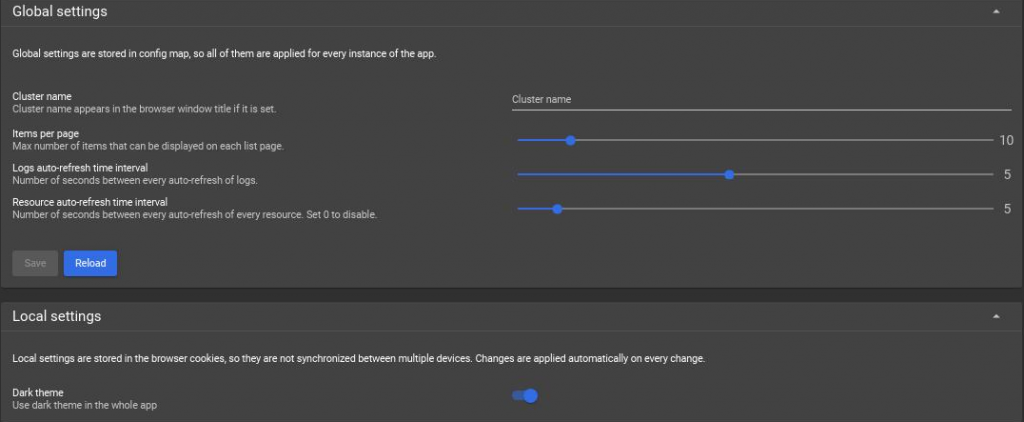
Control panel configuration:
Finally, it has a configuration section where among other elements is the dark mode configuration.
Easy to use
The interface is clear and accessible, but access to the logs generated by the pods and system events is complicated. A more precise element configuration tool is missing.
It cannot be placed behind an ingress that acts as an SSL terminator since it requires the same certificate as the dashboard and that requires a more specific configuration.
It does not show graphs of the relationships between objects, something desirable for a dashboard.
K8dash
With 400 stars, K8dash is presented with a visual format similar to the official Kubernetes dashboard, with two main differences: more space to avoid a text menu and that both events and records appear associated with objects.
How to install
It depends on metrics server so we will first install this service, we will use helm for it (we use helm v3):
cat <<EOF |helm install -f - -n kube-system metrics-server stable/metrics-server
args:
  - --kubelet-insecure-tls
  - --kubelet-preferred-address-types=InternalIP,ExternalIP,Hostname
EOF
We create a namespace to install k8dash:
kubectl create namespace k8dash --dry-run -o yaml | kubectl apply -f -And a system account with administrator capabilities
kubectl create -n k8dash serviceaccount k8dash-sa --dry-run -o yaml | kubectl apply -f -
kubectl create clusterrolebinding k8dash-sa --clusterrole=cluster-admin --serviceaccount=k8dash:k8dash-sa --dry-run -o yaml | kubectl apply -f -
And launch execution of a deployment together with a service for its publication
cat <<EOF |kubectl apply -n k8dash -f -
 ---
apiVersion: v1
kind: Service
metadata:
  name: k8dash
  namespace: k8dash
spec:
  ports:
  - name: http
    port: 80
    protocol: TCP
    targetPort: 4654
  selector:
    app: k8dash
  type: LoadBalancer
---
apiVersion: apps/v1
kind: Deployment
metadata:
  labels:
    app: k8dash
  name: k8dash
spec:
  replicas: 1
  selector:
    matchLabels:
      app: k8dash
  template:
    metadata:
      labels:
        app: k8dash
    spec:
      serviceAccountName: k8dash-sa
      containers:
      - image: herbrandson/k8dash:latest
        name: k8dash
        ports:
        - containerPort: 4654
        livenessProbe:
          httpGet:
            scheme: HTTP
            path: /
            port: 4654
          initialDelaySeconds: 30
          timeoutSeconds: 30
      nodeSelector:
        'beta.kubernetes.io/os': linux
The containers of the two services that deploy this solution are:
docker.io/herbrandson/k8dash latest 7ad7ade9f7eac 38.2MB
gcr.io/google_containers/metrics-server-amd64 v0.3.5 abf04c0f54ff9 10.5MB
So its deployment has to be fast, since both services are small.
Features
To access the dashboard, we need the service account token that we have created previously (it can be obtained with: kubectl -n k8dash get secret `kubectl -n k8dash get secret|grep ^k8dash|awk '{print $1}'` -o jsonpath="{.data.token}"|base64 -d ) and does not allow any other type of authentication.
Since the deployment is not configured with an SSL layer, its direct publication is not recommended, but rather through ingress that acts as an SSL terminator (in our case we have carried out the deployment based on what is explained in How to publish Kubernetes with External DNS, MetalLB and Traefik. so it is configured in its own domain.
Main panel:
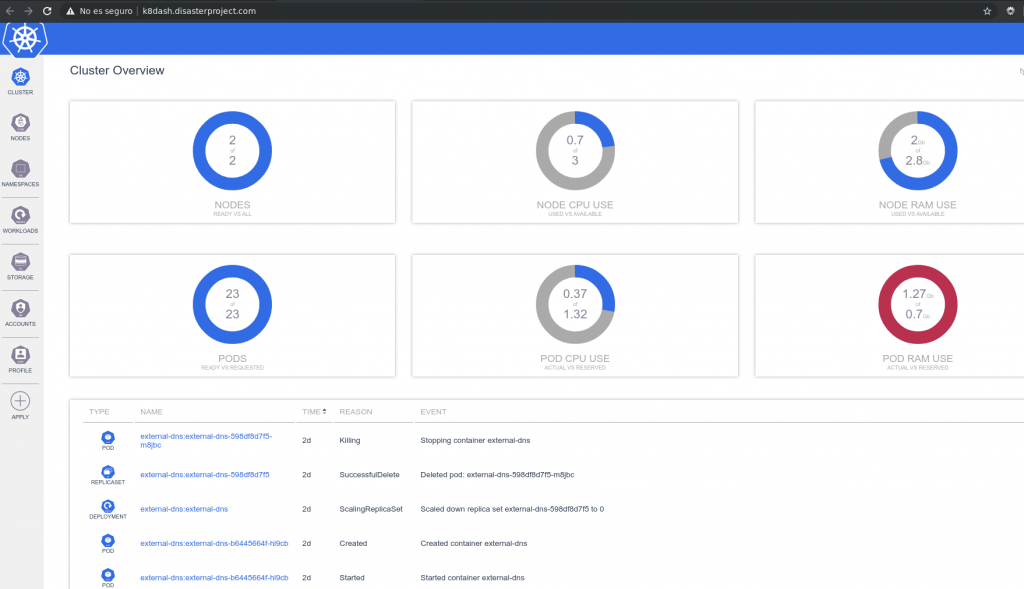
We can see a clean interface, without excess of information and that goes directly to show numerical values and an event panel that is updated in automatically.
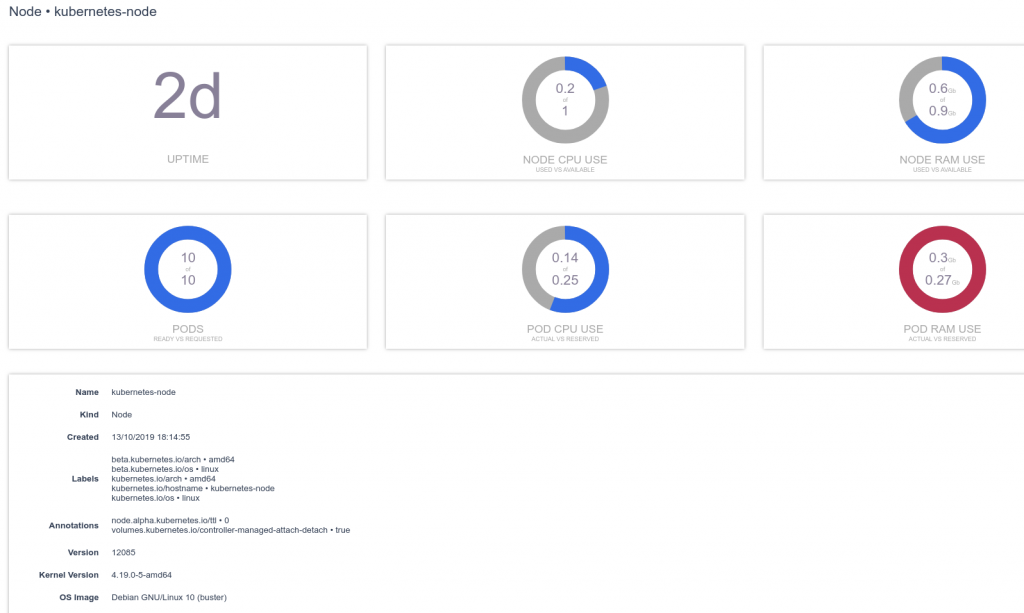
Also in the nodes we see a similar arrangement, and a brief description of the node. More compact graphics would be desirable, since the number could be reduced to three, saving space.
The objects show the same design, it is important to note that as with the official dashboard, K8dash has two options for all objects (edit and delete) and some have added features, in this case, a deployment, you can see the scaling option.
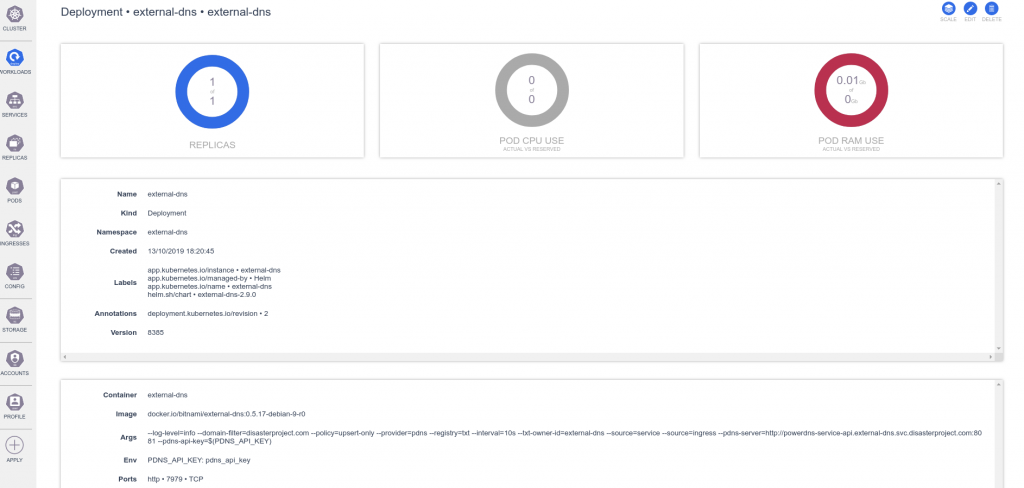
Let’s see the description of a persistent volume

And a secret, as for the official dashboard gives us the option to show the keys.

The role setting is also as the official dashboard style

Easy to use
K8dash is a dashboard visually based on the official dashboard, with important shortcomings such as not displaying CRDs, or a dark mode. But in return it is visually cleaner and all objects show related events.
Both the original dashboard and K8dash are tools that will allow those who begin in the Kubernetes universe to start in the basic objects, in the following article we will examine those more specific dashboards and oriented to show non-generalist information.